
Data Science Overview
Flow-Like combines data access, SQL, machine-learning nodes, model inference, and A2UI visualization in one workflow environment. Use Flows to make the analysis steps and operational handoff inspectable.
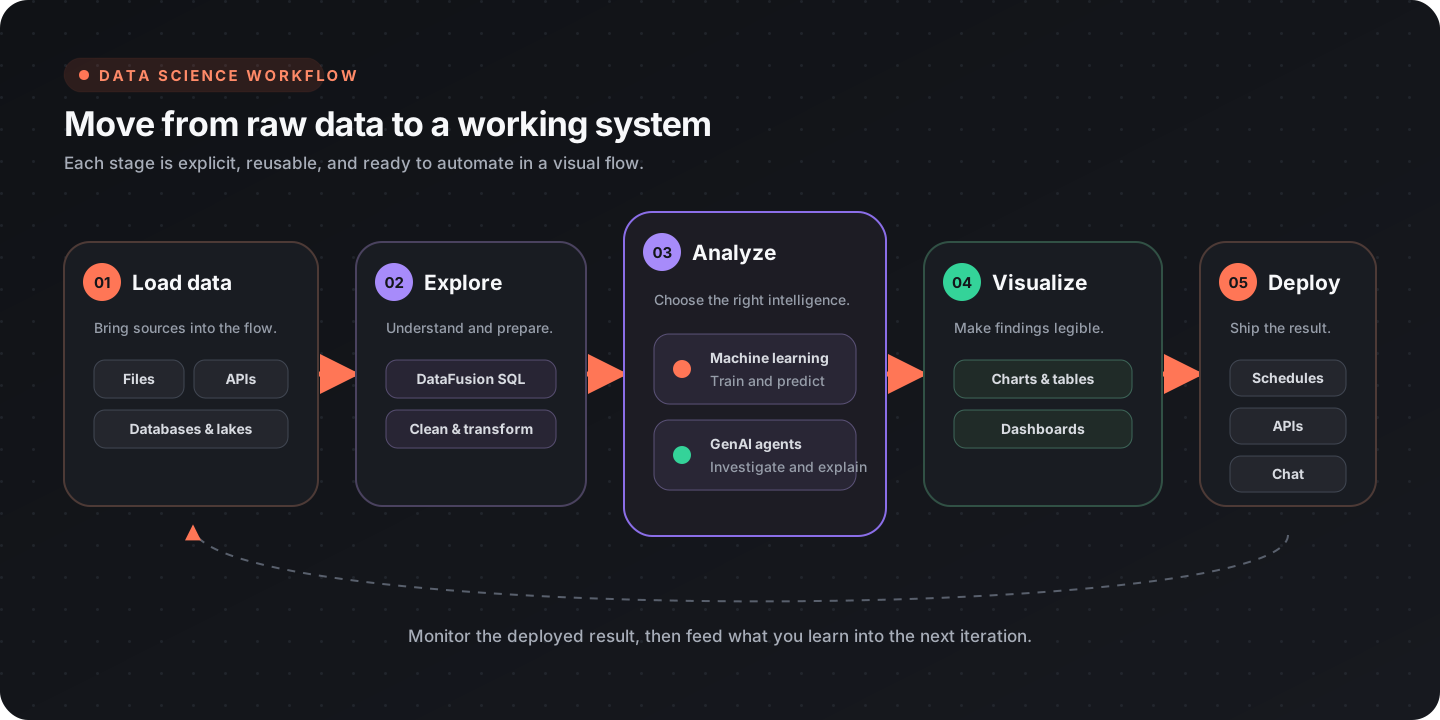
What you can build
Section titled “What you can build”| Application | Flow-Like role |
|---|---|
| Data exploration | Register sources, inspect schemas, and query with SQL |
| Repeatable analysis | Turn cleaning, feature preparation, and metrics into a Flow |
| Machine learning | Split datasets, scale and vectorize features, train supported models, tune them with grid search or AutoML, evaluate, inspect, save, and predict |
| Model inference | Run ONNX vision, OCR, audio, NLP, and related models |
| Interactive dashboards | Push query results into A2UI tables and charts |
| AI-assisted analysis | Combine governed data tools with configured models or agents |
Core capabilities
Section titled “Core capabilities”Load and register data
Section titled “Load and register data”Flow-Like can work with local files, databases, app storage, APIs, and data-lake tables. Start with Data loading and storage when choosing the reader and storage boundary.
DataFusion entry points include:
- Mount CSV, Mount JSON, and Mount Parquet;
- database registration for PostgreSQL, MySQL, SQLite, DuckDB, ClickHouse, and other cataloged sources;
- Delta and Iceberg registration and inspection.
Query and transform
Section titled “Query and transform”Create DataFusion Session provides the query context. Register the required sources, inspect them with List Tables and Describe Table, then use SQL Query.
See DataFusion and SQL for joins, aggregations, and federated analysis.
Train and evaluate models
Section titled “Train and evaluate models”The generated node catalog currently includes:
| Task | Examples |
|---|---|
| Dataset preparation | Split Dataset, Stratified Split, K-Fold Split, Shuffle Dataset, Sample Dataset |
| Preprocessing | Fit Feature Scaler, Fit TF-IDF Vectorizer, Apply Transform |
| Classification | Decision Tree, Naive Bayes, Multinomial Naive Bayes, Logistic Regression, SVM, K-Nearest Neighbours, Random Forest, AdaBoost, One-Class SVM |
| Regression | Linear, Ridge/Lasso/ElasticNet, GLM / Tweedie, K-Nearest Neighbours, SVM |
| Ordinal regression | Proportional Odds, Ridge, Frank & Hall, Continuation Ratio, Adjacent Category, Neural CORAL/CORN |
| Clustering | KMeans, DBSCAN, Gaussian Mixture |
| Reduction | PCA, t-SNE |
| Evaluation | Accuracy, Confusion Matrix, Regression Metrics, ROC-AUC & Log Loss, Silhouette Score, Ordinal Metrics |
| Tuning and AutoML | Grid Search, Auto Classifier, Ordinal Grid Search, Auto Ordinal |
| Model introspection | Model Info, Feature Importance, Get Coefficients, Get Centroids |
| Persistence and inference | Save Model, Load Model, Save Model (Binary), Load Model (Binary), Predict, Apply Transform |
Predict serves the trainers that emit a model. DBSCAN, PCA, and t-SNE return cluster counts, explained variance, or a written-back embedding column instead of a model, and fitted transformers are replayed with Apply Transform rather than Predict.
See Machine learning for the end-to-end workflow, Advanced configuration for the knobs on each trainer, and Auto training for the tuning nodes.
Run ONNX inference
Section titled “Run ONNX inference”The ONNX node catalog includes tasks such as image classification, object detection, segmentation, OCR, face processing, pose estimation, audio preparation, voice activity detection, and named-entity recognition. Model compatibility still depends on the expected input and output tensors; inspect model metadata and validate preprocessing before relying on predictions.
Visualize and operationalize
Section titled “Visualize and operationalize”Use A2UI NivoChart or PlotlyChart components for interactive analysis and Table for detailed records. Workflow nodes can push query results into charts and tables.
See Data visualization for chart selection and Building internal tools for page, data, and action wiring.
Example: sales analysis
Section titled “Example: sales analysis”A compact sales workflow has four explicit stages:
- mount the CSV or register the source table;
- validate the schema and relevant time range;
- aggregate revenue by region with SQL;
- push the result to a bar chart and a supporting table.
The table lets a reviewer verify the values behind the chart, while the workflow preserves the query used to calculate them.
Reproducibility checklist
Section titled “Reproducibility checklist”- Source versions or query windows are recorded
- Schema and data-quality checks run before analysis
- Random seeds are fixed where supported
- Train, validation, and test data remain separate
- Preprocessing used for training is reused for inference — a fitted Feature Scaler replays its exact offsets and scales, while TF-IDF recomputes its document frequencies inside each Apply Transform run
- Model and metric configuration is versioned
- Results include units, filters, and known limitations
- Sensitive features and outputs follow the app’s access policy