
Logging and debugging
Start with the run that produced the unexpected result. The current graph, recorded execution, and log messages answer different questions, so check the Flow version and execution time before changing anything.
Problems, Runs, and Logs
Section titled “Problems, Runs, and Logs”| Panel | What it tells you |
|---|---|
| Problems | Diagnostics for the graph being edited, such as invalid configuration or connections. A diagnostic can exist before execution. |
| Runs | Recorded executions, their start node, Flow version, time, duration, and highest recorded log severity. |
| Logs | Messages for the selected run, attributed to the nodes that produced them. |
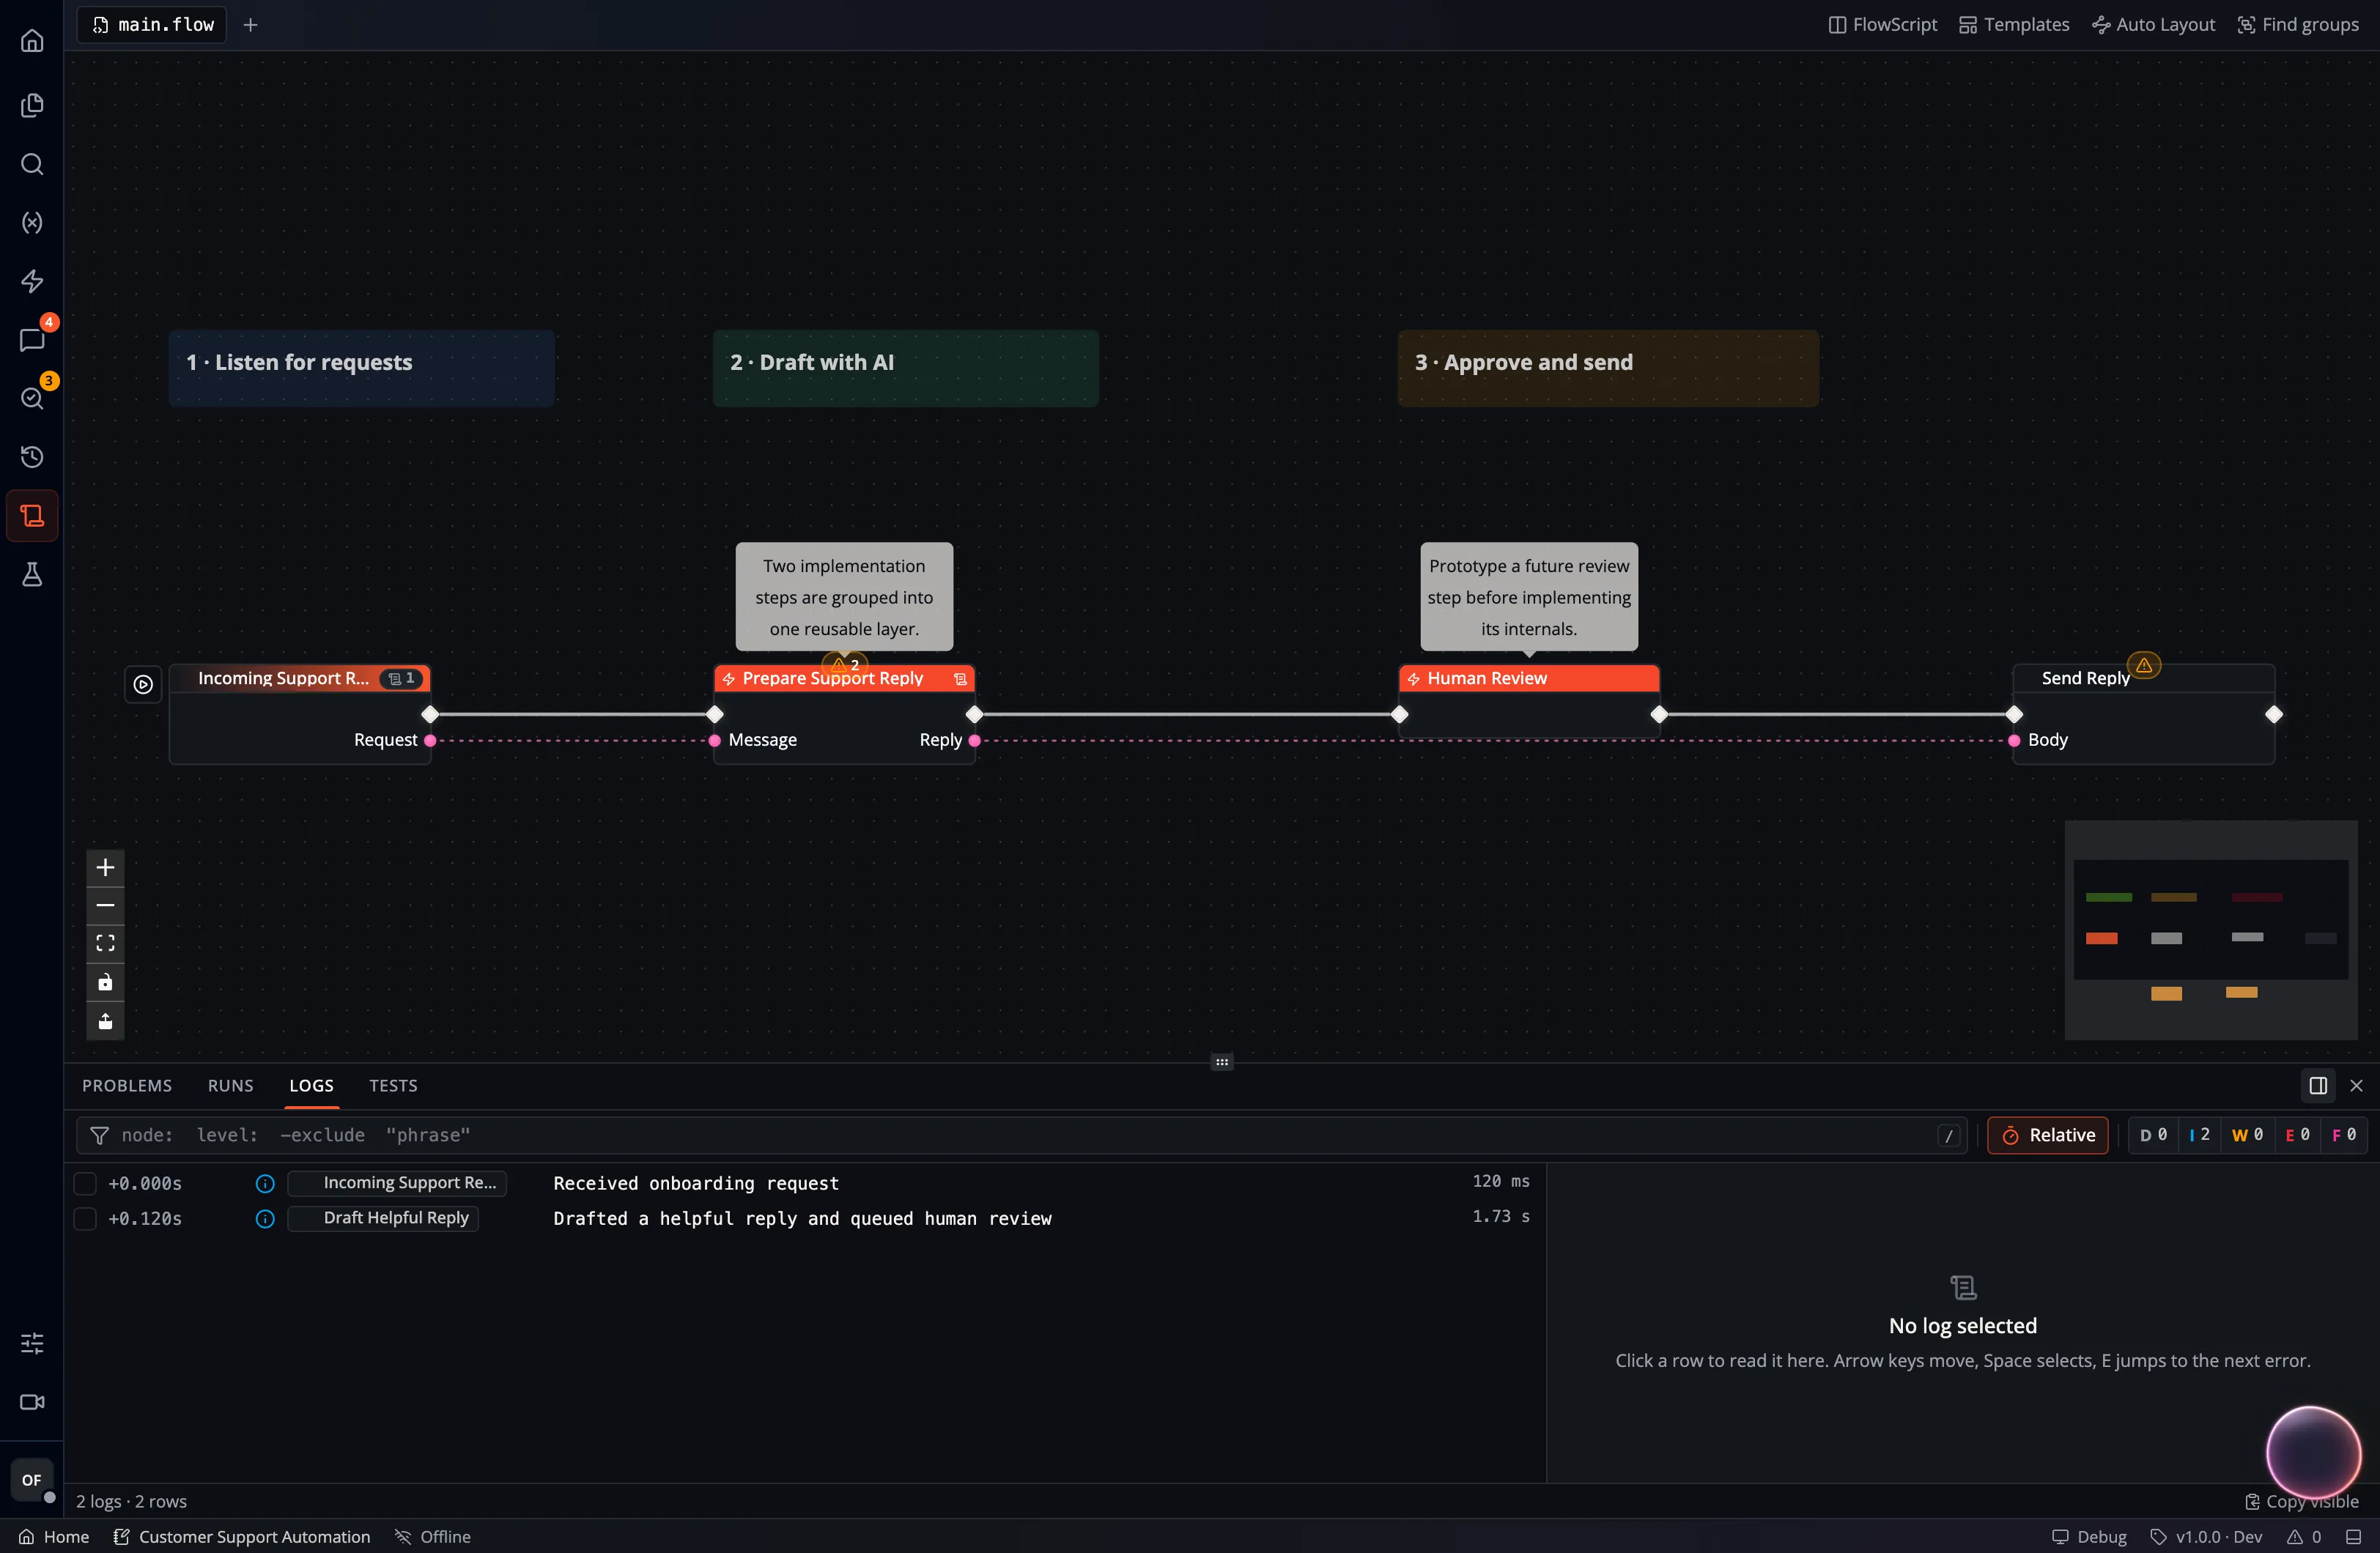
This screenshot uses synthetic support-workflow data to illustrate the Logs panel. The practice exercise below uses Hello Flow.
- Open the Flow and Runs. Refresh if the expected run is absent.
- Identify the run by its start node, version, and time. Selecting an older run can switch Studio to that numbered Flow version. Return to Latest before editing a correction; the old graph is read-only.
- Select the run and inspect Logs. Clear filters before concluding that no errors were recorded.
- Select a log row to read its full message and structured details. Use Show on board to locate its node or Scope to node to narrow the list.
- Follow the first relevant error and its preceding messages. Later errors can be consequences of the same failure.
The error controls move between errors; E goes forward and Shift + E goes
back. The log detail panel supports structured JSON in messages. Search,
severity filters, node scoping, and repeated-message folding help reduce a
large log to the part you need. Copy Markdown exports the selected evidence
for a bug report; inspect it for private data before sharing it.
Interpret severity and failure separately
Section titled “Interpret severity and failure separately”The run list’s severity icon reflects recorded log levels. A node can write an Error message and continue. For example, Print Error logs at Error level and activates its output. That message alone does not establish that execution stopped or that a later write was rolled back.
A failing Assert both logs a failure marker and returns an execution error. Its Pass output stays inactive. To understand a failed run, inspect the actual node error, executed path, and result in the destination system.
Open Run settings in the Studio status bar to choose Log Level. The level determines which messages are retained. Use Info to keep Info assertions and application messages; Debug adds diagnostic detail and per-node timings. Changing the level affects new runs and cannot reconstruct messages omitted from old runs. Do not place passwords or access tokens in custom log messages.
Inspect inputs and values
Section titled “Inspect inputs and values”Use the event input form to check the values supplied for a manual run. Record important intermediate values with Print Info or Print Debug while investigating a specific branch. Structured values remain inspectable in the log detail pane, so include a small relevant object instead of an entire sensitive document.
For a configured remote Event with Quality available, Recorded inputs shows redacted payloads from prior runs. A run listing itself may contain only metadata; the client fetches the stored payload separately when replaying it. Permissions or retention can make that payload unavailable even when the run row remains visible.
Practice: fail, correct, and run again
Section titled “Practice: fail, correct, and run again”Start from Hello Flow. Its only effect is a log and notification, so it is suitable for repeated test runs.
- Add an Assert node between Simple Event and Print Info. Remove the direct execution wire.
- Connect Simple Event’s execution output to Assert’s Input, then Assert’s Pass to Print Info’s Input.
- Set Condition to
false, Label tofirst-check, and Details to the stringPractice failure. - Run the Simple Event and inspect the newest run. Expect an Error message
beginning
ASSERT_FAIL first-check Practice failure. Print Info should not run, because Assert did not activate Pass. - Change Condition to
trueand run again. ExpectASSERT_OK first-checkat Info level, followed by the Print Info message. - Select the older run to confirm its failure evidence remains available.
You have now checked both the failing branch and the correction. For business
logic, replace the fixed Condition with a computed Boolean and use a label
that describes the expectation, such as invoice-total-positive.
Replay deliberately
Section titled “Replay deliberately”A run’s ⋯ → Re-Run action retrieves its recorded input and invokes the matching node in the Flow currently open. It does not restore the old graph, data, credentials, or external services. Check the selected Flow version and available node before using a historical payload to test a change.
A replay is a new execution. Mail, database writes, payments, and API calls can happen again. Use a test destination or a side-effect-free branch when that repeat would be unwanted. If the node or payload is unavailable, correct the cause or supply a deliberate manual test input instead of assuming the replay used the original values.
For a collection of repeatable checks and candidate-version comparison, use Event Quality and releases.
When the evidence is incomplete
Section titled “When the evidence is incomplete”| Observation | Check next |
|---|---|
| No matching run | App, Flow, version, time range, execution location, and refresh state. |
| Run exists but no visible logs | Clear filters, inspect read permissions, and check the Flow’s log level. |
| Some logs failed to load | Retry the failed load before drawing conclusions from the partial list. |
| Error points at a downstream node | Inspect upstream data and the earliest relevant failure. |
| Old run cannot be replayed | Confirm its input is retained and its start node exists in the selected graph. |
| Run looks successful but expected data is missing | Verify the executed branch, returned result, and actual destination; a log message is not a delivery receipt. |
App audit records track management and access activity. Use them to investigate who changed configuration; use run logs to understand what the workflow did. Include the App, Flow/version, run ID, expected result, and a small relevant log excerpt in a support report.